We are developing a new version of Tumor Portal. You can go there and give us some feedback.
We are developing a new version of Tumor Portal. You can go there and give us some feedback.
External References: Wikipedia National Cancer Institute Google Scholar
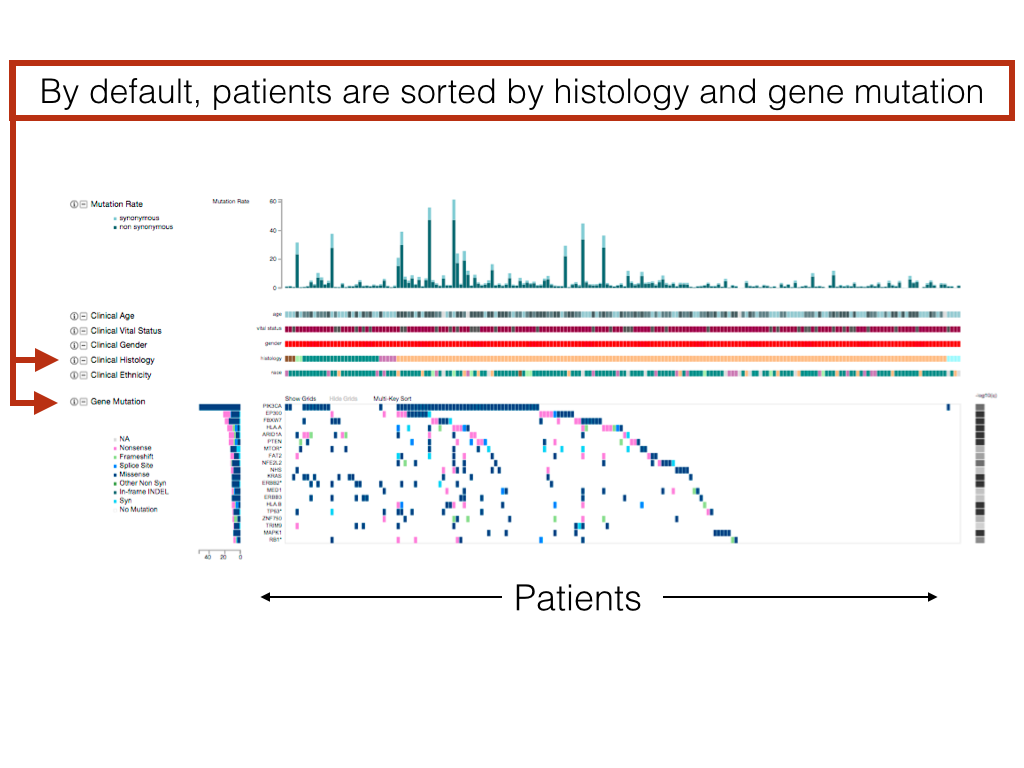
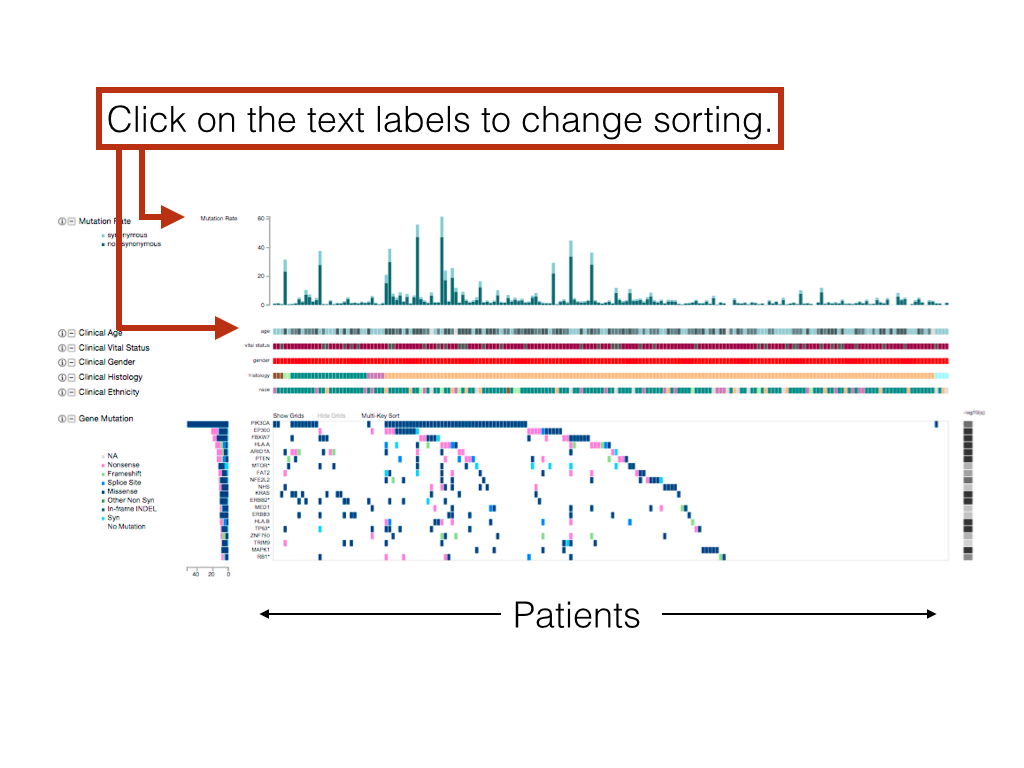
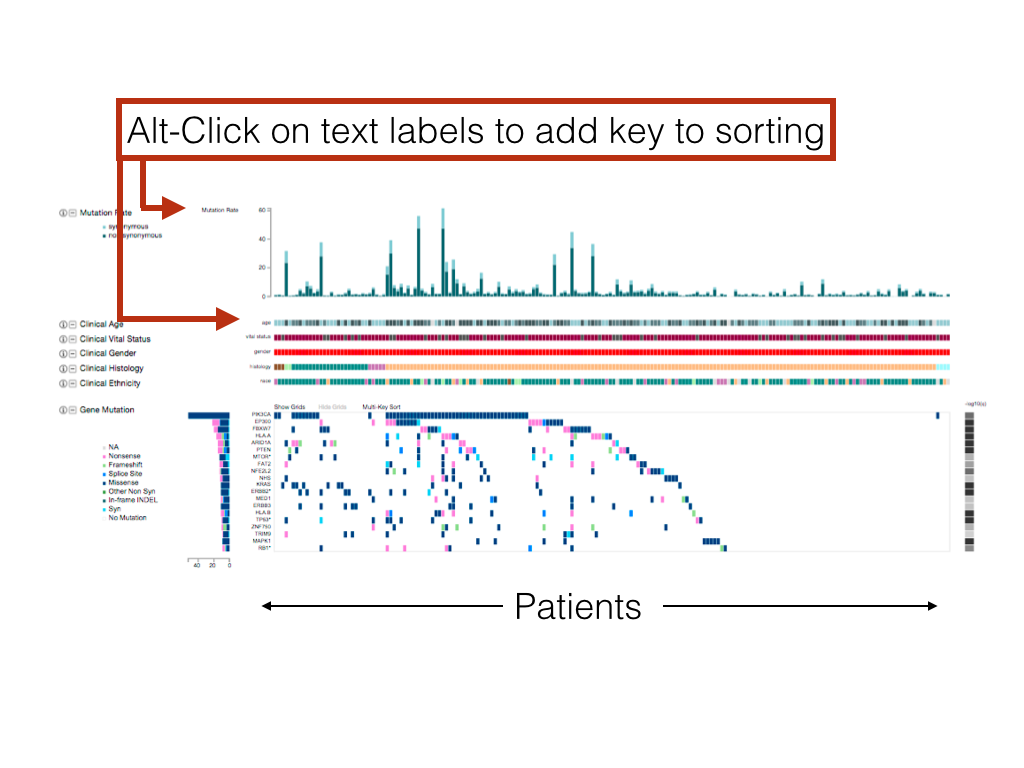
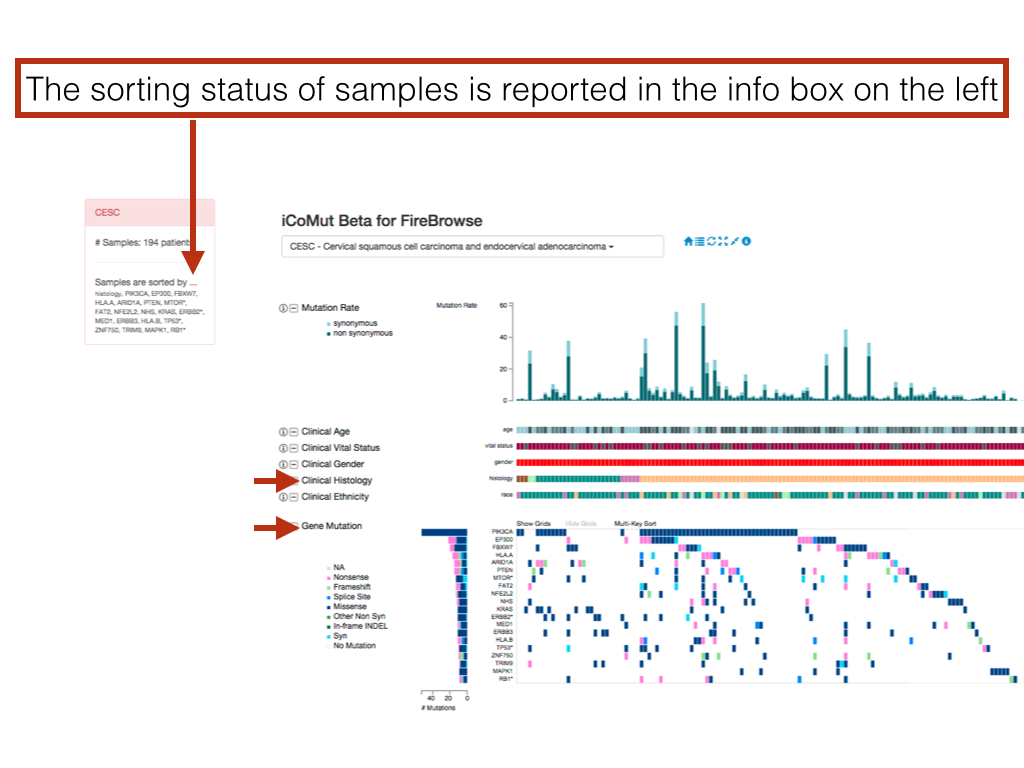
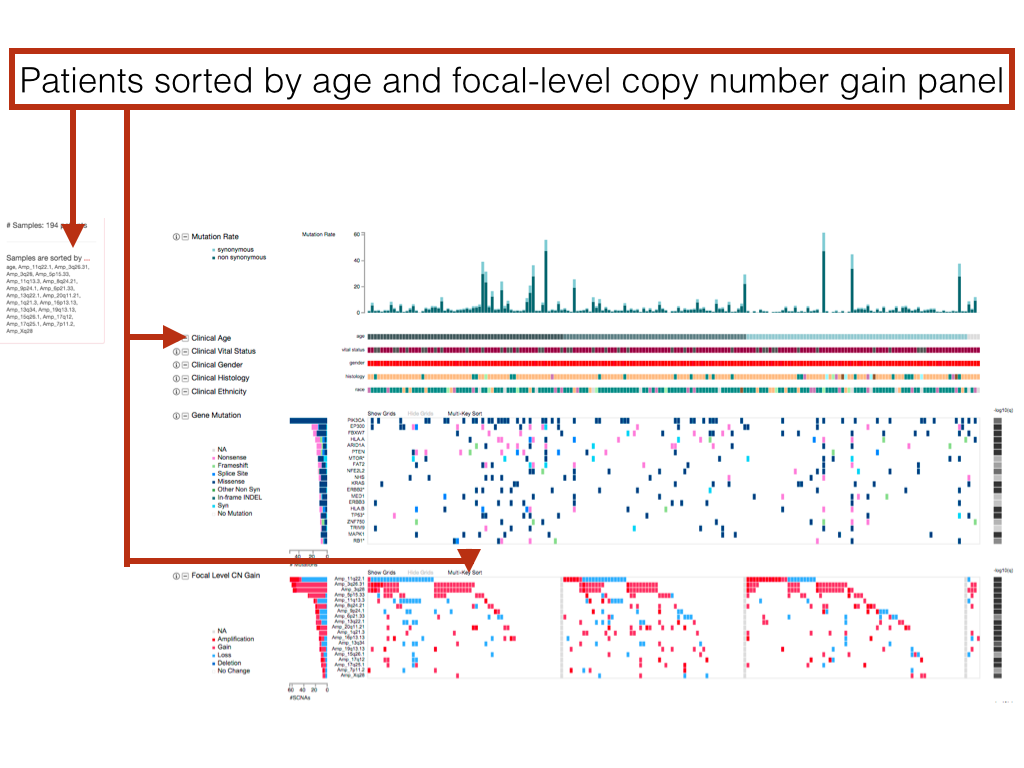
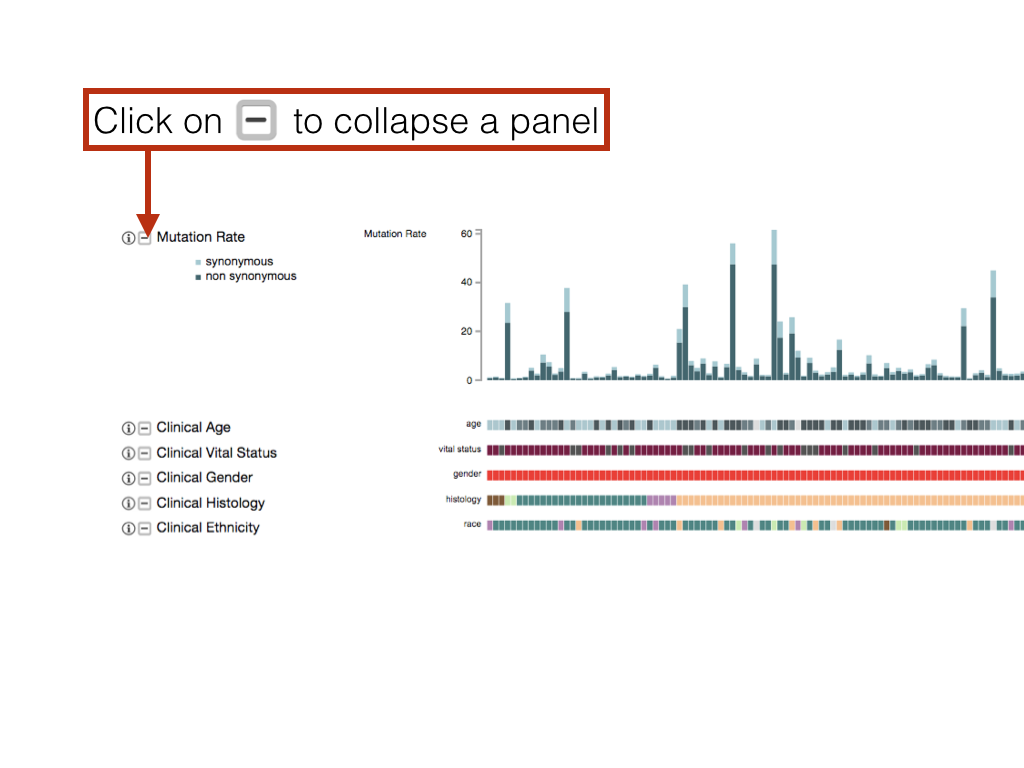
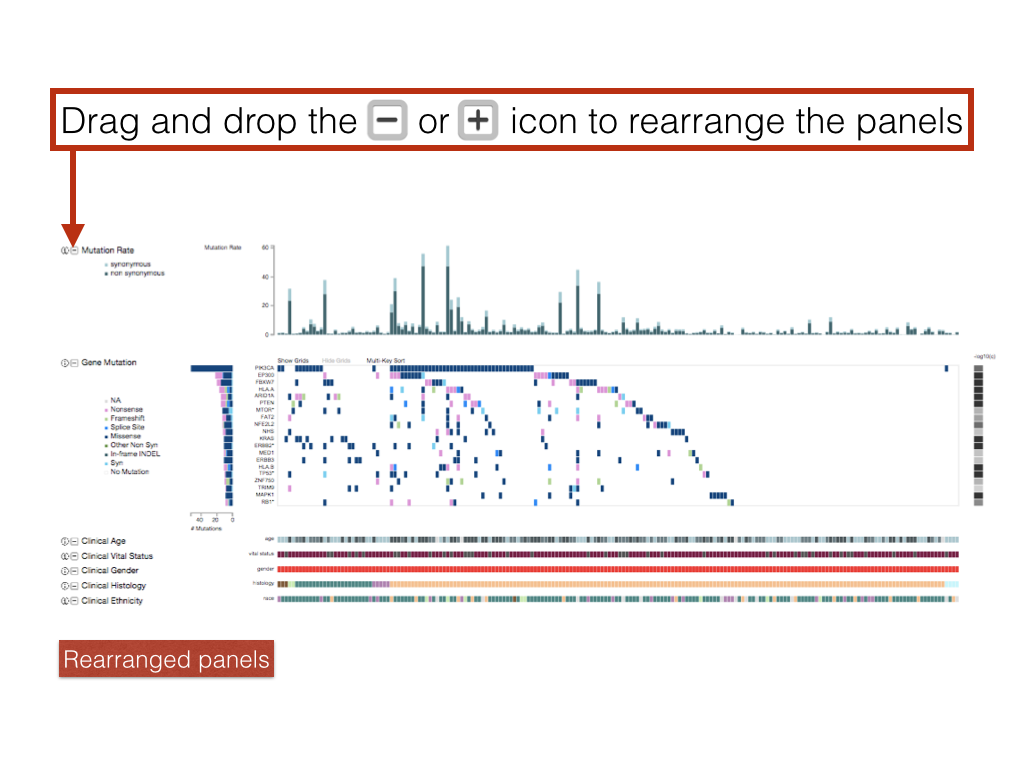
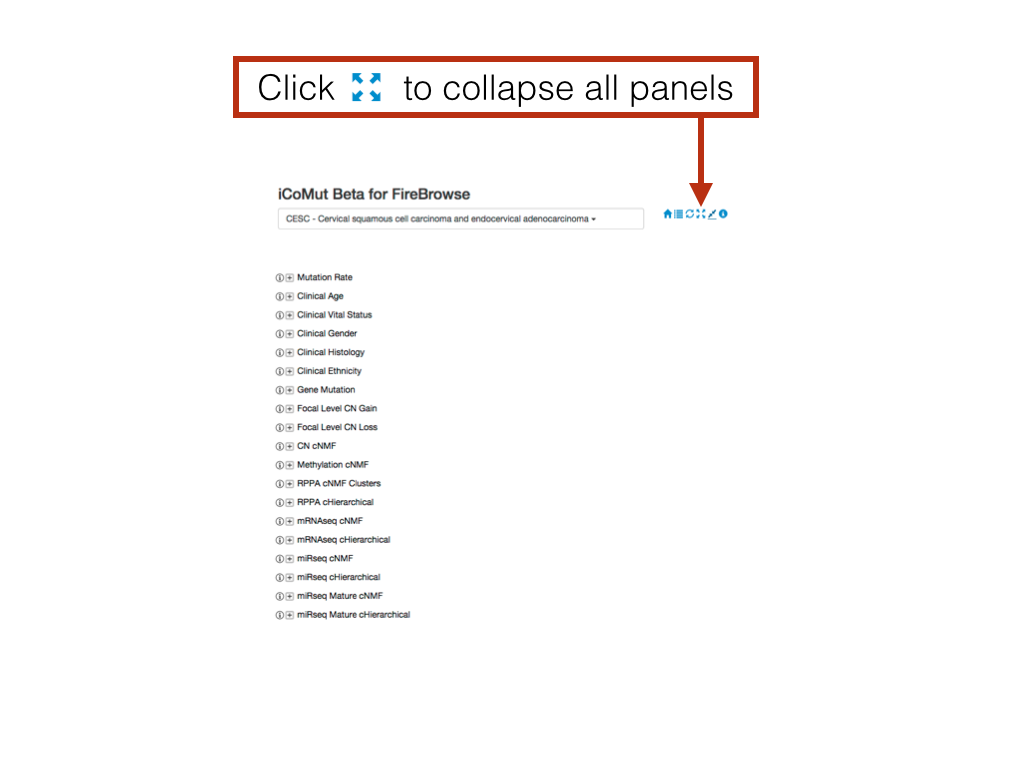
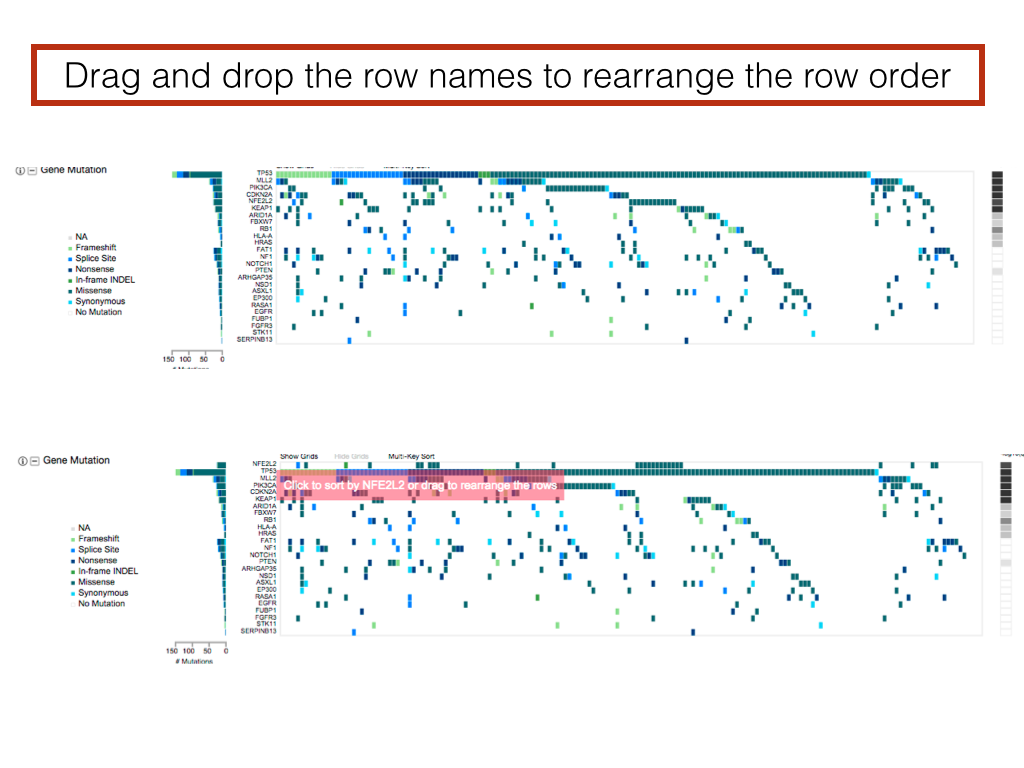
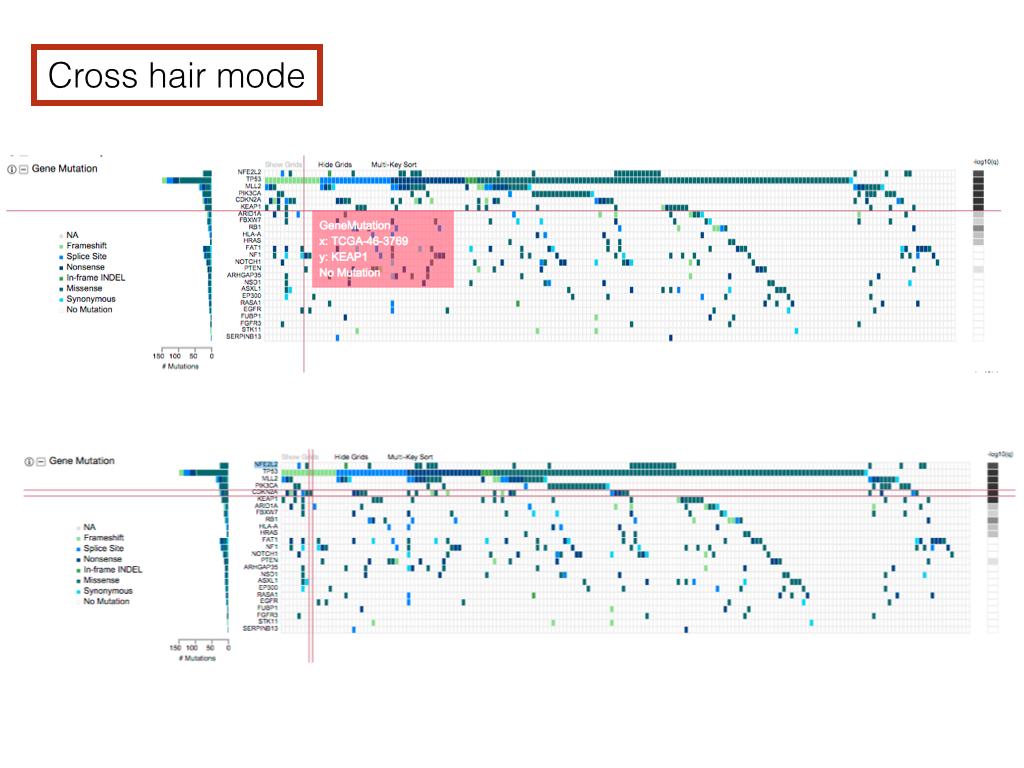
Comut plot, introduced by Nicolas Stransky, is often seen in cancer research publications as a visual summary of genetic variations/mutations in cancer cohorts. The plot itself is essentially an ensemble of multiple smaller and simpler plots (e.g. heat maps and bar graphs) aligned and interconnected via a common X or Y axis. This form of grid-like graphical summary is particularly suitable for presenting data with an intricate and associative nature. iCoMut aims to further transform the static image into an interactive data exploring experience that is flexible and versatile, and through a web-enabled user interface, provides greater public access.
Broad TCGA GDAC data and analyses summaries provided by Jaegil Kim, Hailei Zhang, Juok Cho, and David Heiman.
iCoMut is developed by Katherine Huang, Nome Shoresh, Eila Arich-Landkof, Michael Noble, Gad Getz at Broad Institute.
Notes
• Gene name color indicates:
known cancer genes
|
highly compelling novel candidate cancer genes
|
other candidates
Data details
 TumorPortal
 Sign in